Fall Applied Manure. Will the Nitrogen Still be There?
Manure applications can be a valuable component of a nutrient management program but timing those applications to maximize the utilization of nitrogen can be challenging. Manures generally contain two forms of nitrogen, ammonium and organically bound nitrogen. Ammonium is immediately plant available and relatively immobile in the soil because it is a positively charged ion that held by the cation exchange capacity, like potassium. Organically bound nitrogen is also immobile in the soil, but it is not plant available until the organic matter is microbially decomposed, mineralizing the nitrogen.
In an ideal situation, manure applications would occur either into an actively growing crop or shortly before a crop is planted to gain the most benefit from the nitrogen. Unfortunately, our cold wet soil conditions in the spring and the types of application equipment we have available often do not allow for spring or early summer application. As a result, much of the manure in our region is land applied following harvest in the fall and early winter leaving several months for potential nitrogen loss.
The first step to maximizing the benefits of manure is to keep it on the field and in the soil profile. The most obvious potential loss of nitrogen when manure is fall applied is surface runoff. Runoff can be minimized by avoiding applications on saturated, frozen, or snow-covered ground; incorporation with tillage; or subsurface injection.
Once the manure has been incorporated into the soil profile, there is still the potential for substantial nitrogen loss to occur before the next crop can utilize it. The two potential mechanisms for loss are leaching and denitrification. Leaching has the greatest potential to occur on well drained soils during periods of heavy precipitation. However, for significant losses of nitrogen to occur due to leaching, the nitrogen needs to have been converted to nitrate prior to the precipitation. The conversion of ammonium to nitrate is a microbial process that will only occur when the microbes have adequate temperature and aeration in the soil to be active. Denitrification is the conversion of nitrate to gaseous forms that can be lost to the atmosphere. This is a microbial process that only occurs when soils are saturated, and the microbes are in an anerobic environment. Microbial activity is minimal when soil temperatures are below 50 degrees. If soil temperatures remain cold after application, the chances of significant nitrogen loss are minimized.
The winters and springs in this region are generally cold enough to keep most of the nitrogen in the soil profile. However, over the last few years this has not always been the case. The spring of 2017 was unusually warm with February and March temperatures reaching 70+ degrees. In one situation, using a soil nitrate and ammonium test, we were able to confirm the loss of nearly all the nitrogen following a fall hog manure application that was subsurface injected and treated with a nitrogen stabilizer. The grower in this situation had to supply a full rate of nitrogen fertilizer though sidedress to sustain his corn crop. The next season, following the very cold spring of 2018, the same grower in the same exact situation was able to confirm that no additional nitrogen was needed to produce his crop.
Following a relatively cold winter in 2022, nitrogen losses from fall applied manure should have been minimal so far. If you are planning to plant corn into a fall manured field, a pre-sidedress soil nitrate test is the best tool to assure that you have adequate nitrogen. For more information regarding sampling procedure and data interpretation, please see our fact sheet.Testing Soil Carbon
In this newly emerging world of carbon credits, carbon markets, and carbon banking, the need to quantify and document soil carbon content is becoming more and more important. The challenge with this new market is that the testing methods for soil carbon have not been standardized across the industry. Carbon can be analyzed by several different methods and each method can give you different results.
At A&L Great Lakes Laboratories, soil carbon can currently be analyzed by 3 different methods; loss on ignition, combustion, and Walkley-Black oxidation.
The loss on ignition method is the quickest and cheapest method for estimating soil organic carbon. The process is fairly simple. A portion of the dried and ground soil sample is weighed, then put into an oven to burn off the soil organic matter. The sample is then weighed again, and the change in weight is equal to the organic matter content of the soil. From the organic matter content, the organic carbon content can be calculated by assuming that 58% of the organic matter is carbon.
The combustion method is a way to determine total soil carbon. The simplest explanation is that a weighed portion of the soil sample is heated to the point that both the mineral and organic fractions of the soil combust and the gases are then analyzed to determine the total carbon content. While this is a very accurate method, there is no way to determine whether the carbon originated from the organic matter in the soil, or the mineral fraction. The liming materials that are generally used consist of calcium and magnesium carbonates, and this test will detect this form of carbon also.
The Walkley-Black method determines the organic carbon content of a soil by measuring amount of carbon that is oxidized in a reaction with dichromate through a back titration. While this method is generally considered the most accurate method to determine soil organic carbon, it is also the slowest and most expensive. It also requires the handling of hazardous materials, so it is generally the least preferred method for occupational and environmental safety reasons.
As the carbon farming industry continues to evolve, the methods for analyzing carbon are likely to change as well. When comparing results from separate sampling events, be sure that you know what sampling procedure and method were used so a fair comparison can be made.
2021 Soil Test Data Summaries Are Available
The 2021 annual soil test summaries are available on the ALGL website at https://algreatlakes.com/pages/2021-soil-test-summaries. Your regional ALGL sales agronomist has access to regional trend graphs that show the change in soil test values from 1996 to 2021 for the Great Lakes Region, and individual states, that they can share for use in presentations and meetings as needed.

For those customers accounts that analyze more than 20 soil samples a year, soil test summaries are available for the account. Those summaries can be found on eDocs at https://docs.algreatlakes.com/login.aspx. Be sure to adjust the eDocs’s data filters to include “Summary” as the document type and the time filter to span December 31, when the reports were posted.
These same customers will also find a trend graph of these summaries over time, and a soil sampling history report that summarizes all the field that were sample in that given year. These soil sampling history reports are a great tool when routinely sampling on a 2-, 3-, or 4-year standard rotation. For example, when preparing to soil sample in 2022 on a 2-year cycle, go back to the 2020 Soil Sampling History Report for a list of fields that are due to be resampled in 2022.
Crop Removal Soil Fertility Done Right
For rented cropland, applying phosphorus and potassium fertilizer based on crop removal is common and simple, or so it seems. Theoretically if you apply as much nutrient as is removed in the harvest of grain and/or biomass, soil fertility levels should remain steady. This works well in a cash rent scenario. The soil fertility is maintained at over time for the landowner, and the tenant farming the land is not building up a soil fertility that they may not have access to in the future.
The crop removal fertilizer rate is calculated by multiplying the yield times the nutrient removed per unit of yield. Often this is done without routine soil testing to keep input cost down, further compounding potential issues. Actually, there are three main inputs into the crop removal fertility methodology, the crop removal factor, yield, and soil test values. Let’s look at how each factor can impact the results of a crop removal soil fertility plan.
Often book values are used for crop removal factors, these tend to be slightly higher than actual crop removal in many cases. The nutrient removed per unit of grain can vary quite a bit, biomass harvesting can vary even more. Most book values are identified so that 2/3 to 3/4 of all the values in the dataset fall below the single published value. In most cases using book values for crop removal factors will slightly overestimate the actual crop removal, this helps avoid a short fall in fertilizer application rates. For corn the nutrient removed per bushel often declines with increasing yields. When corn yields increase because of a larger corn kernel, the majority of that kernel is starch comprised of carbon, hydrogen, and oxygen. The germ of the kernel that contains nutrients like nitrogen, phosphorus, and potassium stays relatively the same size. This reduces the concentration of nitrogen, phosphorus, and potassium in the grain. Crop removal can also be impacted by growing conditions and variety. To improve the accuracy of the crop removal values, biomass and grain samples can be sent to the lab for analysis.
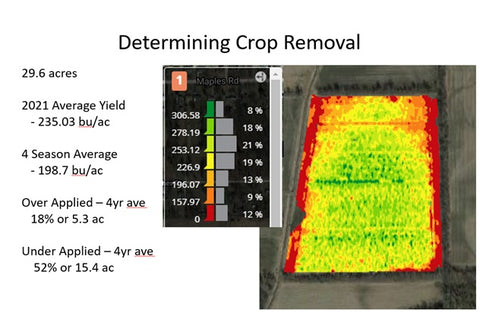
The value used for the yield input can be the source of the greatest errors. Yield is not defined in soil fertility calculations as past measured yield or future predicted yield. Measured yield is usually more accurate than predicted. Often the field average yield or an average of several past years of yield are used for this value. This assumes that the yield is stable from year to year and that the yield is uniform across the field. Often this is not the case. The picture below is a simple example of both issues. This field has a 4-year running average of 198.7 bpa corn, and a realistic yield goal of 200 bpa corn. However, in 2021 the field average yield was 235 bpa. If 200 bpa was used in the calculation, the calculated fertilizer rate could be 15% under actual average crop removal. For this same field if a uniform 200 bpa was to be used, 18% of the field would receive more fertilizer than was removed, and 52% would receive less fertilizer than was removed. Using a flat yield value would lead to excessive fertilizer inputs for the low yielding areas and put the high yielding regions at risk for lost yield potential. While arguments can be made about the accuracy of yield maps, they will identify regions of above average and below average yields. There is an application for variable rate fertilizer application even in a crop removal fertility program.
While soil tests are often seen as a way to predict or prescribe fertilizer application rates, they can also help monitor changes or the results of the fertility management. Soil testing this field after many years of flat rate crop removal revealed that the low yielding areas of the field did not require any fertilizer and the high yielding areas of the field had very low soil fertility levels. Soil fertility maps can be used in conjunction with yield maps to further define fertilizer application rates in a variable rate crop removal fertility plan.
The Key to Nitrogen Management
While high nitrogen prices are a common topic in the media, the key management strategies are nothing new. The key is increased nutrient use efficiency, and for most of our region that means reducing the risk of nitrogen loss. There is a wide continuum of nitrogen rates from 1.4 pounds of nitrogen per bushel of corn to 0.7 pounds of nitrogen per bushel of corn, the difference is the efficiency of nitrogen use.
Ways to increase nitrogen use efficiency:
- Using nitrogen stabilizers delays the conversion of nitrogen to forms that can be lost to the environment.
- Avoid preplant applications of nitrogen. The wider the time gap between nitrogen application and crop uptake, increases the chance of nitrogen loss. In some cases, fall applications of nitrogen, commercial or manure, can take place 7-10 months before the nitrogen is taken up by the crop.
Read more about fall applied manure:
- Split applications of nitrogen throughout the growing season brings the application closer to use and reduces the amount of nitrogen subject to loss at any one time. Split applications also allow for rate adjustments based on the growing season.
- Incorporate all forms of nitrogen if possible. Nitrogen left on the soil surface is subject to volatilization though more than one mechanism. These loss mechanisms are in addition to loss mechanisms the nitrogen is subject to in the soil.
Read more about nitrogen loss mechanisms:
- Apply sulfur. While the application of sulfur does not always increase yield, it often maintains yield at a lower nitrogen rate. The application of sulfur can increase the plant’s efficiency to utilize of nitrogen.
- Avoid situations where high C:N crop residues or livestock bedding material might reduce nitrogen availability to the crop.
Read more about nitrogen release from organic residues:
- Plant crops requiring supplemental nitrogen on fields with higher organic matter contents. The mineralization of nitrogen from soil organic matter can provide a significant nitrogen contribution.
- Use soil nitrate and ammonium tests for manured fields and late nitrogen season applications. For manured fields, early spring weather can have a huge impact on nitrogen loss. PSNT testing can help determine supplemental nitrogen rates for manured fields. For late season split application of nitrogen in corn, nitrate and ammonium testing can dial late season application rates based on in season crop observations and realistic potential yield.
Read more about PSNT in manured fields:
Read more on late season commercial nitrogen rate determination:
- Focus on maximum profit rather than maximum yield. Often with high fertilizer prices focusing maximum yield or apply a bit extra nitrogen as a “insurance policy”, can be rather expensive management strategies. The MRTN model can help evaluate your options. This year it is very important to complete a crop budget ahead of the growing season.
- Tissue tests can monitor nitrogen levels in the plant through the growing season.
Is Reality Becoming Stranger than Fiction?
Editorial by Agronomist Jamie Bultemeier
For the past few years, just prior to the yearend, I have been looking back and reflecting on the happenings and lessons learned as the year comes to a close. So, what did the 2021 growing season show us?
The spring planting season had some minor rain delays, but overall went smoothly. Field operations, while slightly delayed for some, still progressed better the previous few years. Strong commodity prices led to an increase in plant tissue sampling through the season. Overall, the first half of the crop season was good. As the season progressed some challenge began to appear with extended wet or dry weather and the appearance of disease. Harvest started earlier and the soil sample volume to ramped up earlier than normal. Shortly after the strong start of fall harvest, the fall rains began and made harvest a challenge. Unfortunately, there are producers in the region still trying to finish harvest. The fall rains resulted in fields scarred with ruts from harvest that will impact crops for the next few years. Through all of these challenges there were numerous reports of exceptional yields.
During the fall of 2020, the stage was being set for increased fertilizer demand leading to increased fertilizer prices. The fall of 2020 was dry, and yields were good. There was a notable amount on pent up fertilizer demand due to previously low commodity prices, and pent-up soil sampling demand due to several sequential wet fall and spring sampling seasons preventing sample collection. Fall of 2020 set soil sample number and fertilizer application volume records. The record pace of fertilizer consumption and soil sampling continued into the spring of 2021. Early in 2021, the shipment delays of fertilizer began as well. Very good crop condition, with favorable commodity prices, led to strong in season fertilizer use. This kept the demand and supply pressure on the fertilizer market and the market was unable to recover before the fall of 2021. This time last year it would have been reasonable to anticipate increases in fertilizer prices. But how many people forecasted and planned for a 2 to 4 times increase in fertilizer prices occurring in 2021? Now we are preparing for the 2022 season making plans to address the reality that the supply of fertilizer, especially nitrogen, may be limited. We have seen high fertilizer prices before, but widespread supply shortages, that is a new challenge for most of us in agriculture.
We need to be making alternate plans in the event any given input is unavailable or increases in price 10-fold. Producers and suppliers need to be asking themselves, “How do I produce a profitable crop if “x” is not available/accessible?” These kinds of shortages are not impossible in agriculture, they have occurred. During the 1973-74 energy crisis, and WWII, fuel was in short supply. Agricultural supply shortages are something we have not experienced in recent years. Some herbicide chemistries are also looking to be in short supply for the coming growing season. Tires and machinery parts may continue to be a concern as well.
Each year as I write this article I sit for a moment and think, what challenges might next year bring. What challenges and opportunities lie in store for producers in the coming year based on the outcomes of the current year? As a producer, and a professional agronomist, I try plan for the extremes and the worst-case scenario when developing and executing a nutrient management plan. Drought and excessive rain are always in the plan. Then there is planning for the unexpected, that seems to be growing more difficult each year. Maybe even to a point beyond what is conceivable in the planning process. Two years ago, I did not contemplate the impact of a global pandemic, and last year I did not consider the impacts of a widespread global supply chain disruption. Maybe my planning for 2022 should include the evaluation of what impact an alien encounter would have on crop production. Anything is possible. It almost seems that reality becoming stranger than fiction.
Don’t Overlook Manganese
Manganese (Mn) is a nutrient that is often overlooked in the Great Lakes region since it rarely tests as low or deficient in our soils. In fact, nearly 90% of soils tested at ALGL test at adequate or higher levels. However, this is not the case for corn and soybean plant tissue tests. It is quite common for plant tissues to test low or deficient in Mn.

Where does this discrepancy between soil and tissue tests come from? The simple answer is that just because the Mn is present in the soil, does not mean that it is in a form that the plants can uptake. Manganese availability is highly dependent on soil pH, it is most available when the pH is around 6.5. As the pH approaches 7.0 or higher, the availability is greatly reduced. Another factor that reduces the availability of Mn is organic matter. Manganese is highly reactive with organic matter and forms bonds with it making it impossible for plants to access it.
The good news is that there are options available to manage Mn. The best option is to maintain your pH around 6.5. However, this is not always possible, many areas in the Great Lakes region have naturally alkaline soils. In these areas, both soil applied, and foliar applied Mn fertilizers can be used successfully. In areas with high organic matter, foliar applied fertilizers tend to be more successful. If the pH and the organic matter are both high, a chelated form of Mn is the best option to maintain availability.The Seven Most Expensive Words in Agriculture – Fertilizer Prices
The seven most expensive words in agriculture are “I have always done it that way.” This is ever so true with increased fertilizer prices facing producers this coming production year. While the high fertilizer prices in articles are often blamed on the greed of fertilizer manufacturers, these same articles also often conveniently omit any conversation on supply and demand. If producers continue to buy fertilizer at the same or greater rate as when prices are low, this is a signal that the market can and will bear the increased input cost. If the fertilizer prices get to a point where producers cut back and purchase less, this will reduce demand and put downward pressure on prices. At that point market prices should stabilize or decline. From ALGL agronomist conversions with clients, prices have hit the point in which producers are starting to ask about wisely reducing fertilizer application rates.
Old habits are hard to break, but with current fertilizer prices it is an ideal time to break with tradition and look to what opportunities there are to decrease the fertilizer budget while maintaining profitability. Yes, focusing on max profits and not max yield. This may require that producers manage their fertility different than they have in the past. Also, changes do not have to be wholesales across the operation, a change on a portion of the operation may have big impacts. This might be the time to try a new practice that has been of interest. Either way focusing on greater nutrient utilization is key.
Some effective ways to reduce fertilizer costs while maintaining profitability.
- Correct soil pH to ensure maximum nutrient availability
- Focus fertilizer rates to maximum financial return rather than maximum yield
- Utilize yield maps to better represent crop removal rather than field averages
- Band phosphorus in fields with low phosphorus levels
- Subsurface fertilizer placement
- Side dress or utilize late season N application, when possible, to increase nitrogen use efficiency
- Add fertigation to irrigation equipment
- Use nitrogen modeling in conjunction with in-season ammonium and nitrate testing to dial in nitrogen rates
- Utilize manures when ever possible
- Apply sulfur to increase nitrogen use efficiency in all crops
- Utilize tissue testing to keep a watchful eye on crop nutritional needs
- Based crop removal on actual yields not projected yields or inflated yield goals
- Focus on annual applications of P and K rather than multi-year spreads.
- Rather than applying N for a maximum yield, focus on maximum returns
- Forgo building soil test levels, maybe only apply crop removal or a reduced build rate
- If you must go below crop removal, focus on fields with the highest fertility levels.
- If you must go below crop removal, cut phosphorus rates before potassium, potassium levels tend to decrease in soil test faster than phosphorus
- Soil test more frequently or at a greater density
Times of high fertilizer process like this are why it is best to focus on building soil test levels of P and K (where applicable) and building soil organic matter when you can. Maintaining good soil fertility provides flexibility to reduce nutrient application in challenging times. Those acres with limited fertility are at the greatest risk of poor profitability this coming growing season. Your ALGL regional agronomist is ready to help you with any questions you may have.
Here are some great resources to dig deeper into these concepts:
Helms, Alex, "Effect of Potassium Fertilizer in a No-Till Corn and Soybean Rotation with very low Soil Test Potassium" (2021). Creative Components. 854. https://lib.dr.iastate.edu/creativecomponents/854
Camberato, J. Using Phosphorus and Potassium Fertilizers Wisely. (2021). Purdue Univ. Dept. Agronomy Soil Fertility Update. https://thekernel.info/wp-content/uploads/2021/10/Using-P-and-K-wisely-finalrev.pdf
Camberato, J., B. Nielsen, D. Quinn. Nitrogen Management Guidelines for Corn in Indiana. (2021). Purdue Univ. Dept. Agronomy Soil Fertility Update. https://thekernel.info/wp-content/uploads/2021/10/NitrogenMgmt.pdf
By Gary Schnitkey, Nick Paulson, and Krista Swanson, Department of Agricultural and Consumer Economics, University of Illinois, and Carl Zulauf, Department of Agricultural, Environmental and Development Economics, Ohio State University. Management Decisions Relative to High Nitrogen Prices. (2021). FarmDocDaily. https://farmdocdaily.illinois.edu/2021/10/management-decisions-relative-to-high-nitrogen-fertilizer-prices.html.
Lory, John, “Managing Potassium and Phosphorus When Prices Are High”. (2021). University of Missouri Extension. https://extension.missouri.edu/news/managing-potassium-and-phosphorus-when-prices-are-high-5411.
Sampling Wet Soils
This fall’s untimely and widespread rain events have slowed down harvest and soil sampling. Soon, many will be faced with the decision to either delay sampling or attempt to sample in less-than-ideal conditions. Here are a few tips on how to still get quality data from wet soil samples.
Maintain consistent sampling depth. Wet soil tends to compress below the tip of a soil probe. To combat this, first use a probe with a tip designed for wet soils. Also, a deeper core can be collected to ensure that you are getting the full depth and simply discard the excess soil from the lower portion of the probe.
Avoid cross-contamination of samples. Mud sticks to everything, especially soil probes. Remove as much soil from your probe as possible between sampling points. WD-40 and cooking sprays can be used to lubricate soil probes to ease soil removal and minimize carry over to the next sample without impacting your soil test results.
Make sure the lab can identify your sample when it arrives. The soil sample bags available from the lab are designed to keep moisture in. However, if the outside of the bag gets wet, there is the potential for identifying information on the bag to be lost. When wet, printed labels can easily come off and handwritten information can easily be smudged. Use good quality labels, waterproof if possible, or use permanent markers.
Keep your shipping materials as dry as possible. Wet boxes do hold up in shipment. Do not pack your boxes in the field if you can not keep them dry. Use another container while in the field and pack your shipping boxes in a dry location where the outside to the sample bags can be dried off if necessary.
Your job is to collect a quality soil sample and get it to the lab in a good condition. From there, the state-of-the art soil drier at ALGL will take care of the rest to ensure that you get reliable results from wet samples.
Where In The World Did That Information Come From?
Social Media, podcasts, and radio are great ways to share agronomic ideas and knowledge over a wide geography, however the listener needs to keep in mind that the information can be geographically biased, and how bias that can impact how applicable the information being shared is to your business.
Recently one of our clients was listening to a program that noted that, “any quality soil lab should perform a nitrate nitrogen test as part of a basic routine test.” The client had called to inquire why the S1 basic soil test package at ALGL does not include a nitrate nitrogen test.
If the client was collecting soil samples from an arid region of the US, such as the western parts of Kansas, Oklahoma, Nebraska, or the Dakotas, Montana, or Western Canada, it would be advisable to add nitrate to a routine soil test to measure residual nitrate at the end of the season. If the winter months provide a large portion of the annual rainfall in the region where the sample was collected, but annual rainfall totals still falls under 10-20 inches, it may be best to hold off till spring to test for the residual soil nitrogen. Either way nitrate soil tests in these regions can indicate significant nitrogen levels in the soil available for the next growing crop, especially where the drought conditions during the 2021 growing season reduced soil water and crop growth.

Source: NOAA, 2021
Now compare that to the central and eastern portions of the corn belt. As you move east the annual rainfall increases by a factor of 4 to 7. This creates extended time periods of soil moisture leading to quicker conversion of ammonium nitrogen sources to nitrate. It also increased the frequency of saturated soil conditions leading to denitrification and loss, as well as increased leaching of nitrate down through the soil profile. All of these factors increase the chance of nitrogen loss from the crop root zone.
In these eastern regions any residual nitrogen from the growing season reflected in fall soil samples is usually lost though the winter, or taken up by a cover crop. Either way the nitrogen is not present in a traditional 6-8” soil sample used in the region. A fall soil nitrate test may show some excess nitrate in the soil, however the nitrogen most likely will not make it through the winter to the next growing season. Unless a manure is applied, a spring soil nitrogen test will usually only reflect low native soil levels, normally less than 10 ppm. Spring nitrate nitrogen tests commonly range from 4 to 7 ppm, representing less than 15 - 30 pounds of applied N. Regardless of the lab location, the statement is only applicable to samples collected in the western portion of the US and Canada.
Menu
Store
Copy of About (Footer)
![]()
A&L Great Lakes Laboratories, Inc. is an independently owned and operated agricultural testing laboratory located in Fort Wayne, Indiana. Our intent is to deliver fast, accurate analyses that you can trust to make your most important decisions.
© 2026 A&L Great Lakes. | 3505 Conestoga Drive, Fort Wayne, Indiana 46808 | 260.483.4759 | Policies
